
Most students meet data science through datasets that mean nothing to them: iris petals, housing prices, the tips at a restaurant they will never visit. But every one of them has feet. And every one of them will spend their adult life surrounded by data: in the news they read, the jobs they apply for, and the AI tools they will use daily. Knowing how to question a dataset, spot what it leaves out and read variation in a plot is now as basic as reading a map. That is why we provided a sample of Volumental foot scans as a teaching dataset for US middle and high school classrooms.
Published in the Harvard Data Science Review
In April 2026 the team behind the project published its method for preparing datasets for classrooms, using the Volumental sample as the worked example: "Useful, Not Just Usable: Design Considerations for Instructionally Meaningful K-12 Data Sets" by Leticia Perez, Sara Salisbury, Frieda Reichsman, Kirsten Daehler, Nicole Wong and Rasha Eslayed, Harvard Data Science Review, Issue 8.2, April 2026. The authors cite Volumental as an example of how industry can give educators a ready-to-teach derivative of a commercial dataset "while maintaining appropriate safeguards."
The 3D Feet data biography
WestEd and The Concord Consortium run the Boosting Data Fluency project, funded by the US National Science Foundation, which trains math and science teachers in grades 6 to 9 to teach with data. Their format for classroom-ready data is the Instructional Data Biography: a dataset packaged with plain-language documentation, investigation questions, curriculum links and a live copy inside CODAP, a browser-based data tool built for schools.
"3D Feet" is one of eight data biographies in the collection. Volumental supplied the raw material: an anonymized random sample of 2,000 scans, 1,000 women and 1,000 men, drawn from foot scans taken in North American footwear stores between October 2018 and December 2019. The same kind of scan data underpins our published research, including "Analysis of 1.2 million foot scans from North America, Europe and Asia" in Scientific Reports, a Nature Portfolio journal. Each of the 2,000 rows describes one person with ten measurements: length, width, instep height and heel width in millimeters, and first toe angle in degrees, each for both feet, plus the self-reported US shoe size, the industry length for that size, and whether the two agree.
Figure 1: The 3D Feet data biography in WestEd's activity player. Figure from Perez et al., "Useful, Not Just Usable", Harvard Data Science Review 8.2 (2026)
What students find when they play with it
The investigation questions the teachers wrote are a simplified version of the questions our footwear research team answers for footwear brands:
- For one shoe size, how much does foot width vary?
- Are your two feet the same size?
- How common is a first toe angle that would need medical attention?
- How often do people wear a shoe size that does not match their foot?
Drag length and width onto a CODAP plot and the answer to the first question is immediate: people with the same foot length spread across a wide range of widths and instep heights. In this sample, 208 people have a foot length within 2.5 mm of 255 mm, a US women's 9 or men's 8 on the size table the dataset uses. Their widths run from 91 to 107 mm between the 5th and 95th percentile, a 16 mm spread, and the extremes sit 24 mm apart. Instep height varies by a similar amount. Foot length, most often the only measurement a shoe size encodes, turns out to be a weak description of a foot.
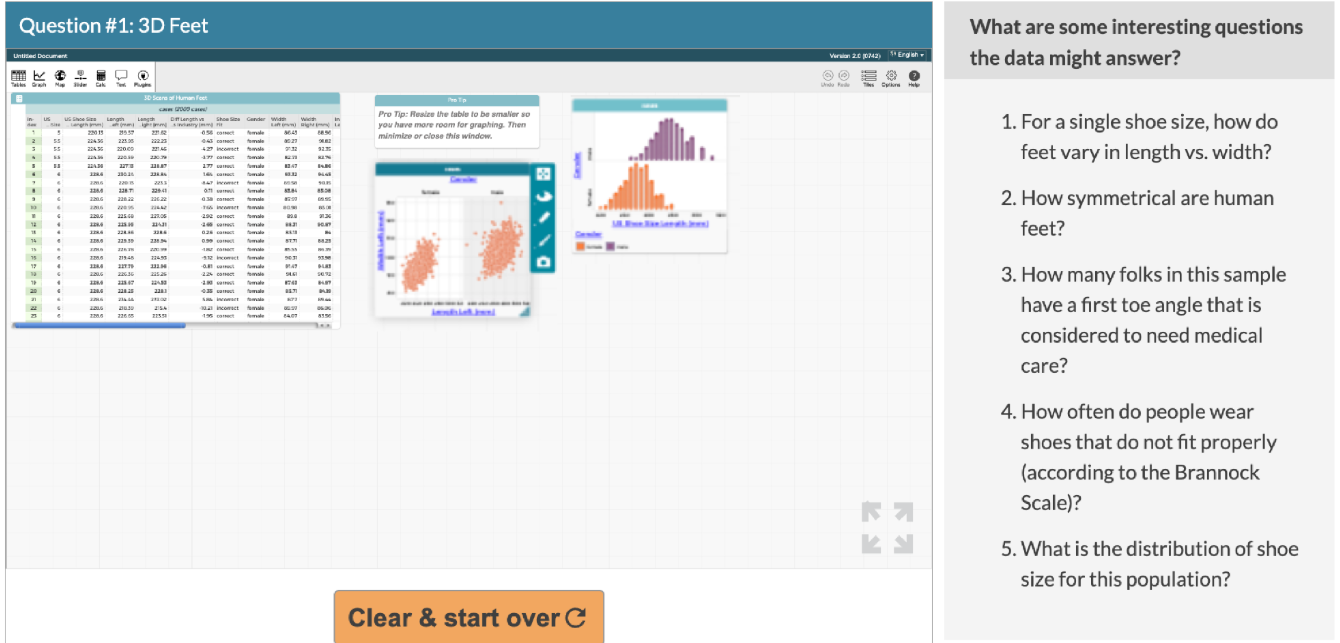
Figure 2: The 3D Feet dataset inside CODAP, with the investigation questions teachers wrote for it. Figure from Perez et al., "Useful, Not Just Usable", Harvard Data Science Review 8.2 (2026)
The second question is where the dataset gets personal. Students can measure their own feet, drop the numbers into the same plot, and see where they land against 2,000 other people. Most will find their feet differ from each other: in this sample, one person in three has a left and right foot that differ in length by more than 3 mm, and one in ten by more than 5 mm. Many will find their self-reported shoe size does not match the size their foot length maps to. That is the most useful lesson in the set, and it is not about statistics. A shoe that fits is a shoe that matches your foot's shape, not just its length. Students who learn this at 13 will buy shoes differently for the rest of their lives.
Why we did it
Volumental has scanned more than 85 million feet in 3,000+ stores across 60+ countries. That dataset exists to help brands design and fit shoes. Sharing a small, anonymized slice of it with teachers gives students a dataset they can play with. Our vision is a world where no one buys anything that doesn't fit. It starts with awareness: feet vary in more than length, and two feet of the same length can differ substantially in shape. The more shoppers look for shoes that fit their own foot shape, the more brands that fit well will gain, and the rest will have to follow.
More footwear brands each year come to us to improve the fit of their shoes with measured foot data rather than assumptions. If you run a footwear brand and want to know what the full dataset says about your customers' feet, read about Volumental's R&D services at volumental.com/volumental-rd-services.